AI Insights
AI Insights generates on‑demand reports from your Netdata telemetry to explain what happened, why it happened, and recommended next steps. Reports use per‑second metrics, local anomaly scores, and correlation across nodes, then present evidence and actions in a concise, shareable format.
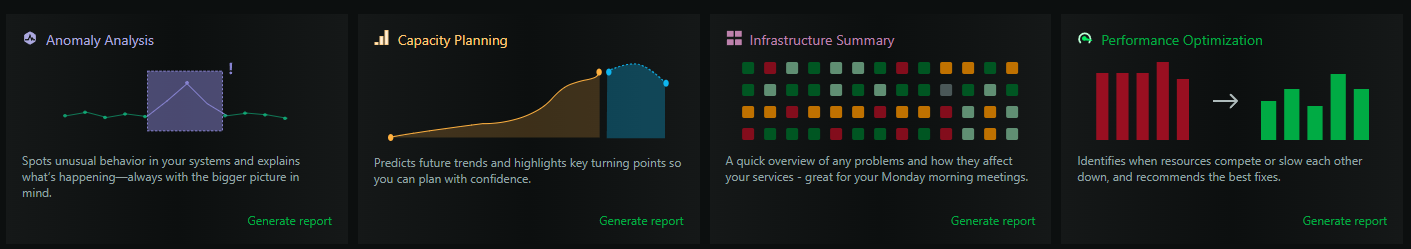
Report types
Schedule recurring runs: Scheduled Reports
Generate a report
- Open Netdata Cloud → Insights
- Select a report type
- Configure time range and scope (rooms/nodes)
- Optional: adjust sensitivity or focus (varies by report)
- Click Generate (reports complete in ~2–3 minutes)
Reports appear in the Insights tab and are downloadable as PDFs. An email notification is sent when a report is ready.
Parameters and scope
- Time range: 6h–30d typical windows; longer ranges supported by some reports
- Scope: entire Space, selected rooms, or specific nodes
- Sensitivity/focus: report‑specific options (see the individual report pages)
Output
- Executive summary with key findings
- Evidence: charts, anomaly timelines, alert/event context
- Recommendations with rationale
- PDF download and shareable view in Netdata Cloud
How it works (high level)
- Collects the relevant metrics, anomaly scores, and alerts from your agents
- Compresses them into a structured context (summaries, correlations, timelines)
- Uses a model to synthesize explanations and recommended actions from that context
Do you have any feedback for this page? If so, you can open a new issue on our netdata/learn repository.