Netdata Charts
Learn how to use Netdata's powerful charts to troubleshoot with real-time, per-second metric data.
Netdata excels in collecting, storing, and organizing metrics in out-of-the-box dashboards. To make sense of all the metrics, Netdata offers an enhanced version of charts that update every second.
These charts provide a lot of useful information, so that you can:
- Enjoy the high-resolution, granular metrics collected by Netdata
- Examine all the metrics by hovering over them with your cursor
- Filter the metrics in any way you want using the Definition bar
- View the combined anomaly rate of all underlying data with the Anomaly Rate ribbon
- Explore even more details about a chart's metrics through hovering over certain elements of it
- Use intuitive tooling and shortcuts to pan, zoom or highlight areas of interest in your charts
- On highlight, get easy access to Metric Correlations to see other metrics with similar patterns
- Have the dimensions sorted based on name or value
- View information about the chart, its plugin, context, and type
- View individual metric collection status about a chart
These charts are available on Netdata Cloud's Metrics tab, single sode tabs and on your Custom Dashboards.
Overview
A Netdata chart looks like this:
With a quick glance you have immediate information available at your disposal:
Fundemental elements
While Netdata's charts require no configuration and are easy to interact with, they have a lot of underlying complexity. To meaningfully organize charts out of the box based on what's happening in your nodes, Netdata uses the concepts of dimensions, contexts, and families.
Understanding how these work will help you more easily navigate the dashboard, write new alerts, or play around with the API.
Dimensions
A dimension is a value that gets shown on a chart. The value can be raw data or calculated values, such as the
average (the default), minimum, or maximum. These values can then be given any type of unit. For example, CPU
utilization is represented as a percentage, disk I/O as MiB/s, and available RAM as an absolute value in MiB or
GiB.
Beneath every chart (or on the right-side if you configure the dashboard) is a legend of dimensions. When there are multiple dimensions, you'll see a different entry in the legend for each dimension.
The Apps CPU Time chart (with the context apps.cpu), which visualizes CPU utilization of
different types of processes/services/applications on your node, always provides a vibrant example of a chart with
multiple dimensions.
Dimensions can be hidden to help you focus your attention.
Contexts
A context is a way of grouping charts by the types of metrics collected and dimensions displayed. It's like a machine-readable naming and organization scheme.
For example, the Apps CPU Time has the context apps.cpu. A little further down on the dashboard is a similar
chart, Apps Real Memory (w/o shared) with the context apps.mem. The apps portion of the context is the type,
whereas anything after the . is specified either by the chart's developer or by the family.
By default, a chart's type affects where it fits in the menu, while its family creates submenus.
Netdata also relies on contexts for alert configuration (the on line).
Families
Families are a single instance of a hardware or software resource that needs to be displayed separately from similar instances.
For example, let's look at the Disks section, which contains a number of charts with contexts like disk.io,
disk.ops, disk.backlog, and disk.util. If your node has multiple disk drives at sda and sdb, Netdata creates
a separate family for each.
Netdata now merges the contexts and families to create charts that are grouped by family, following a
[context].[family] naming scheme, so that you can see the disk.io and disk.ops charts for sda right next to each
other.
Given the four example contexts, and two families of sda and sdb, Netdata will create the following charts and their
names:
| Context | sda family | sdb family |
|---|---|---|
disk.io | disk_io.sda | disk_io.sdb |
disk.ops | disk_ops.sda | disk_ops.sdb |
disk.backlog | disk_backlog.sda | disk_backlog.sdb |
disk.util | disk_util.sda | disk_util.sdb |
Title bar
When you start interacting with a chart, you'll notice valuable information on the top bar:

The elements that you can find on this top bar are:
- Netdata icon: this indicates that data is continuously being updated, this happens if Time controls are in Play or Force Play mode.
- Chart title: on the chart title you can see the title together with the metric being displayed, as well as the unit of measurement.
- Chart status icon: possible values are: Loading, Timeout, Error or No data, otherwise this icon is not shown.
Along with viewing chart type, context and units, on this bar you have access to immediate actions over the chart:
- Chart info: get more information relevant to the chart you are interacting with.
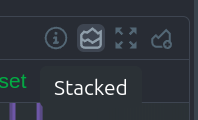
- Chart type: change the chart type from line, stacked, area, stacked bar and multi bar.
- Enter fullscreen mode: expand the current chart to the full size of your screen.
- Add chart to dashboard: add the chart to an existing custom dashboard or directly create a new one that includes the chart.
Definition bar
Each composite chart has a definition bar to provide information and options about the following:

- Group by option
- Aggregate function to be applied in case multiple data sources exist
- Nodes filter
- Instances filter
- Dimensions filter
- Labels filter
- The aggregate function over time to be applied if one point in the chart consists of multiple data points aggregated
- Resetting the Definition bar
NIDL framework
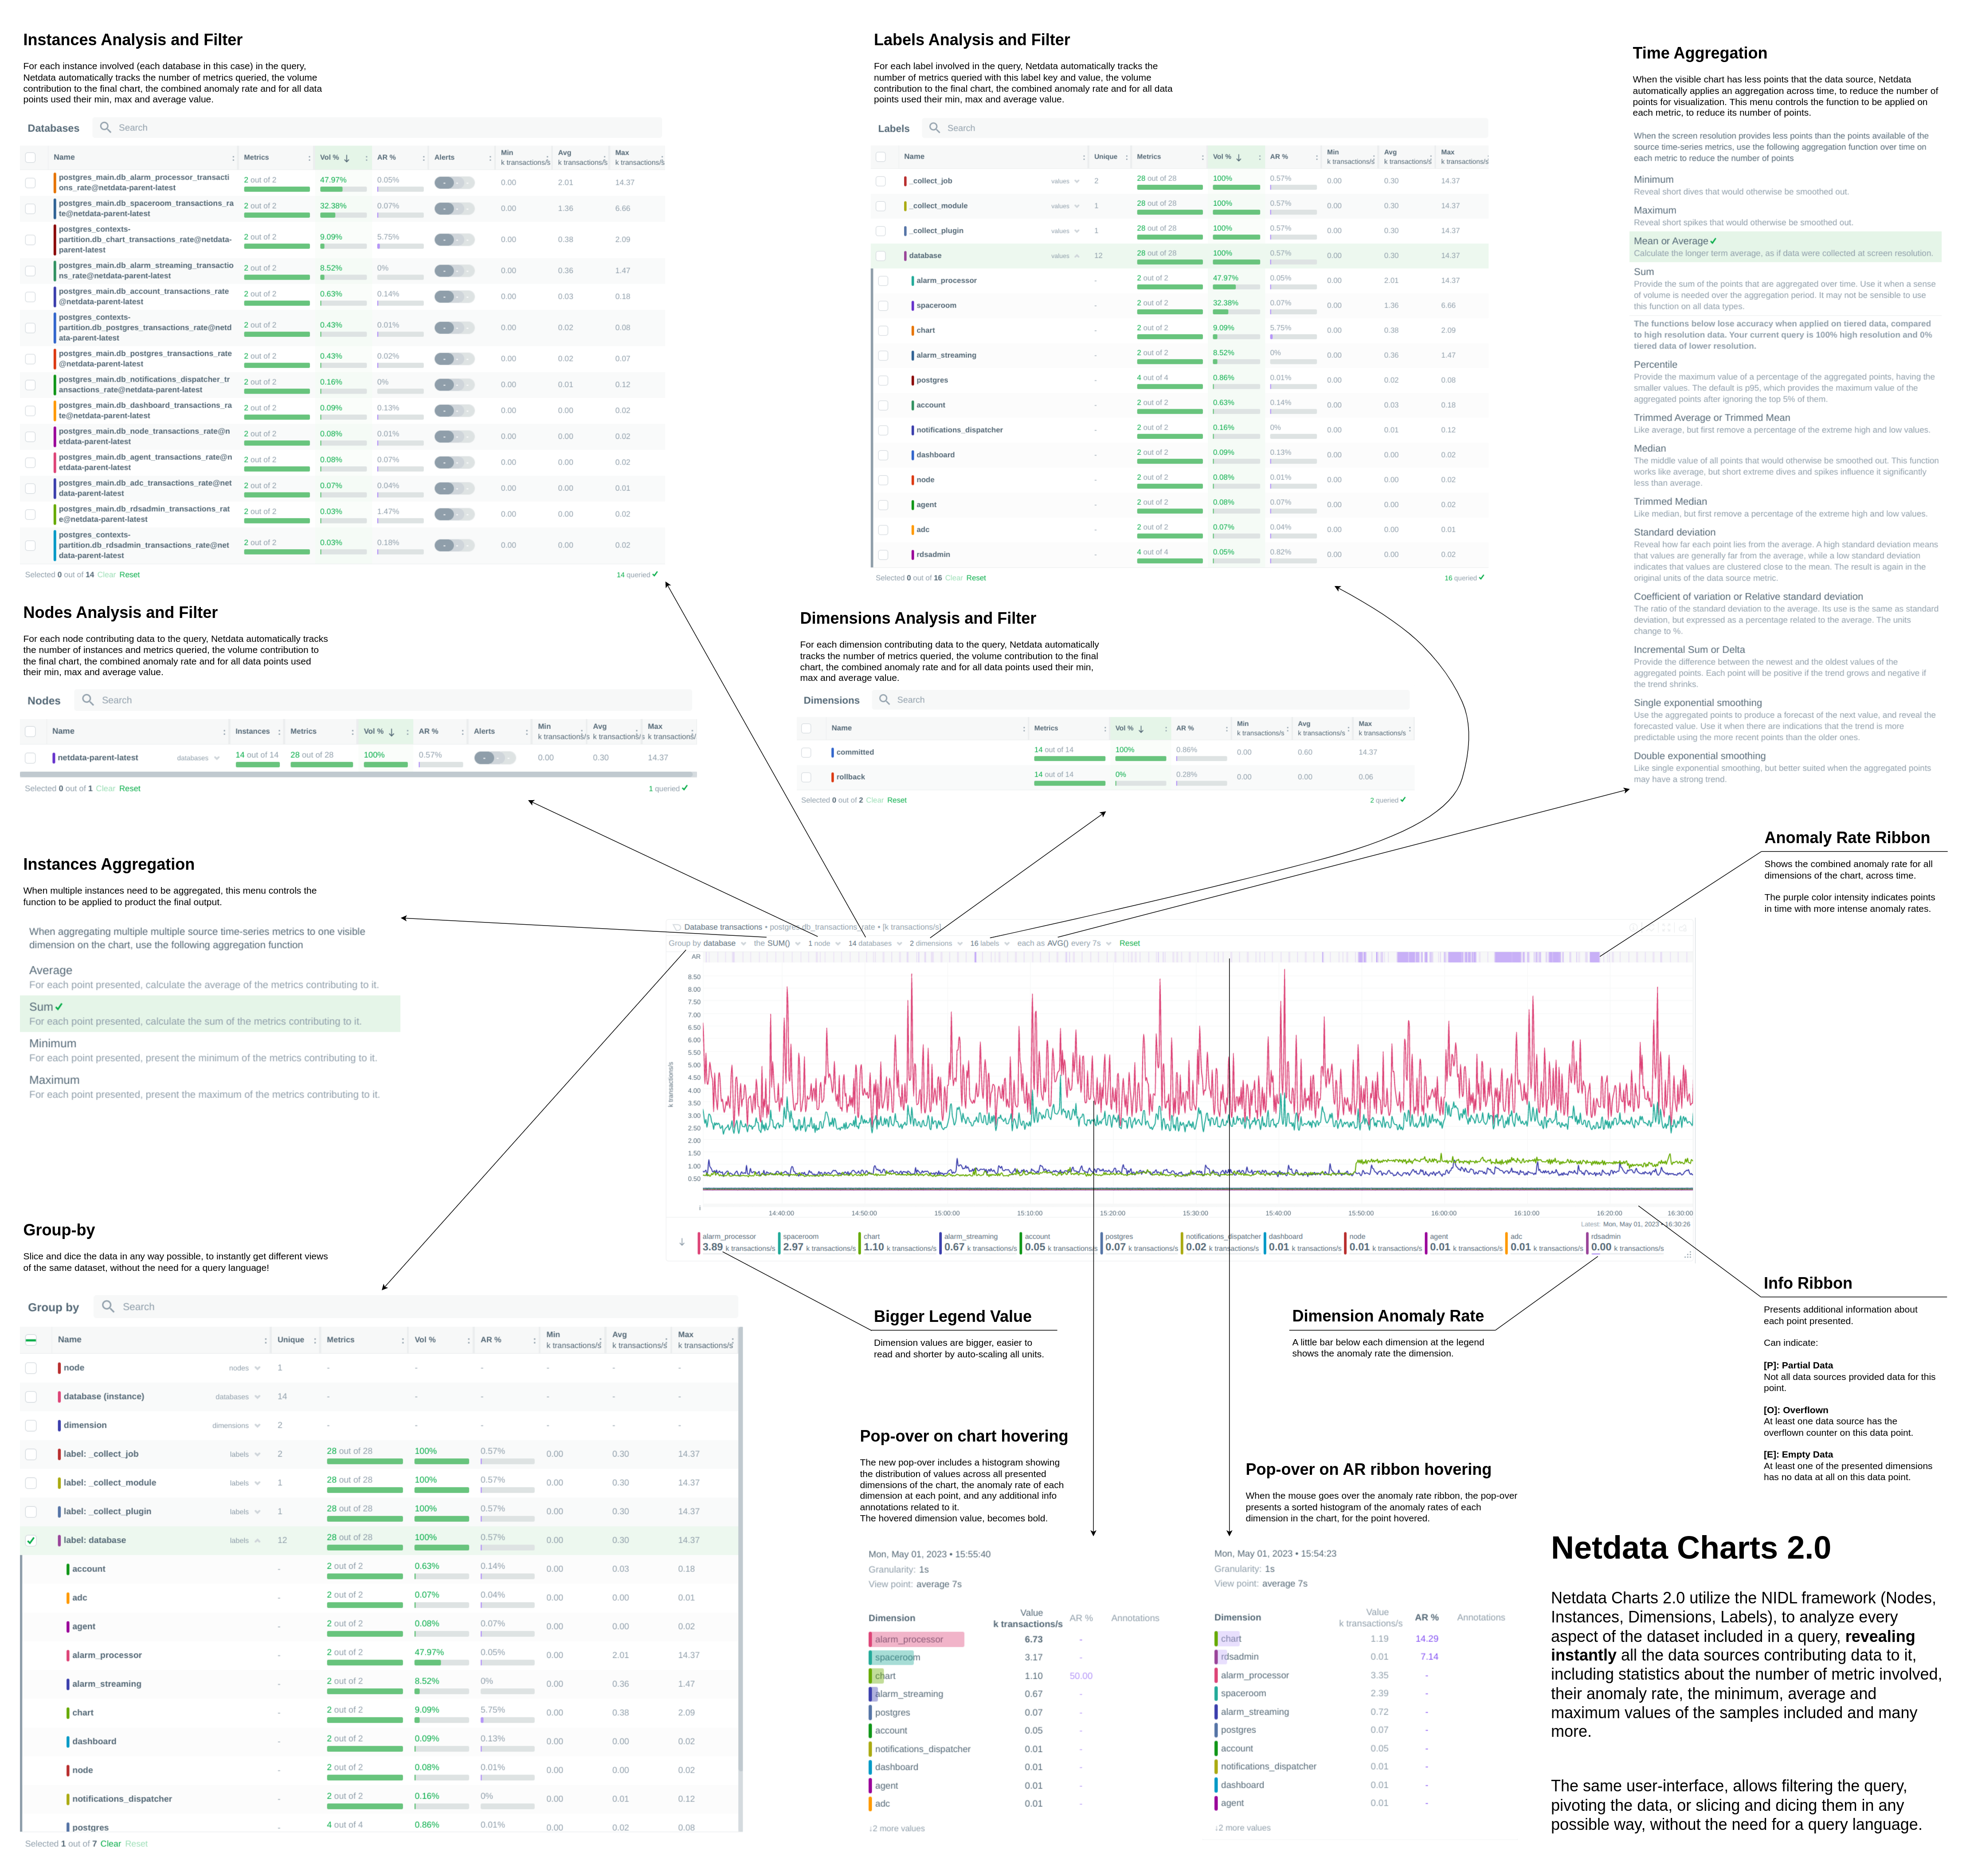
To help users instantly understand and validate the data they see on charts, we developed the NIDL (Nodes, Instances, Dimensions, Labels) framework. This information is visualized on all charts.
You can explore the in-depth infographic, by clicking on this image and opening it in a new tab, allowing you to zoom in to the different parts of it.
You can rapidly access condensed information for collected metrics, grouped by node, monitored instances, dimension, or any key/value label pair.
At the Definition bar of each chart, there are a few dropdown menus:
These dropdown menus have 2 functions:
- Provide additional information about the visualized chart, to help with understanding the data that is presented.
- Provide filtering and grouping capabilities, altering the query on the fly, to help get different views of the dataset.
The NIDL framework attaches metadata to every metric that is collected to provide for each of them the following consolidated data for the visible time frame:
- The volume contribution of each metric into the final query. So even if a query comes from 1000 nodes, the contribution of each node in the result can instantly be visualized. The same goes for instances, dimensions and labels. Especially for labels, Netdata also provides the volume contribution of each label
key:valuepair to the final query, so that you can immediately see how much every label value involved in the query affected the chart. - The anomaly rate of each of them for the time-frame of the query. This is used to quickly spot which of the nodes, instances, dimensions or labels have anomalies in the requested time-frame.
- The minimum, average and maximum values of all the points used for the query. This is used to quickly spot which of the nodes, instances, dimensions or labels are responsible for a spike or a dive in the chart.
All of these dropdown menus can be used for instantly filtering the information shown, by including or excluding specific nodes, instances, dimensions or labels. Directly from the dropdown menu, without the need to edit a query string and without any additional knowledge of the underlying data.
Group by dropdown
The "Group by" dropdown menu allows selecting 1 or more groupings to be applied at once on the same dataset.
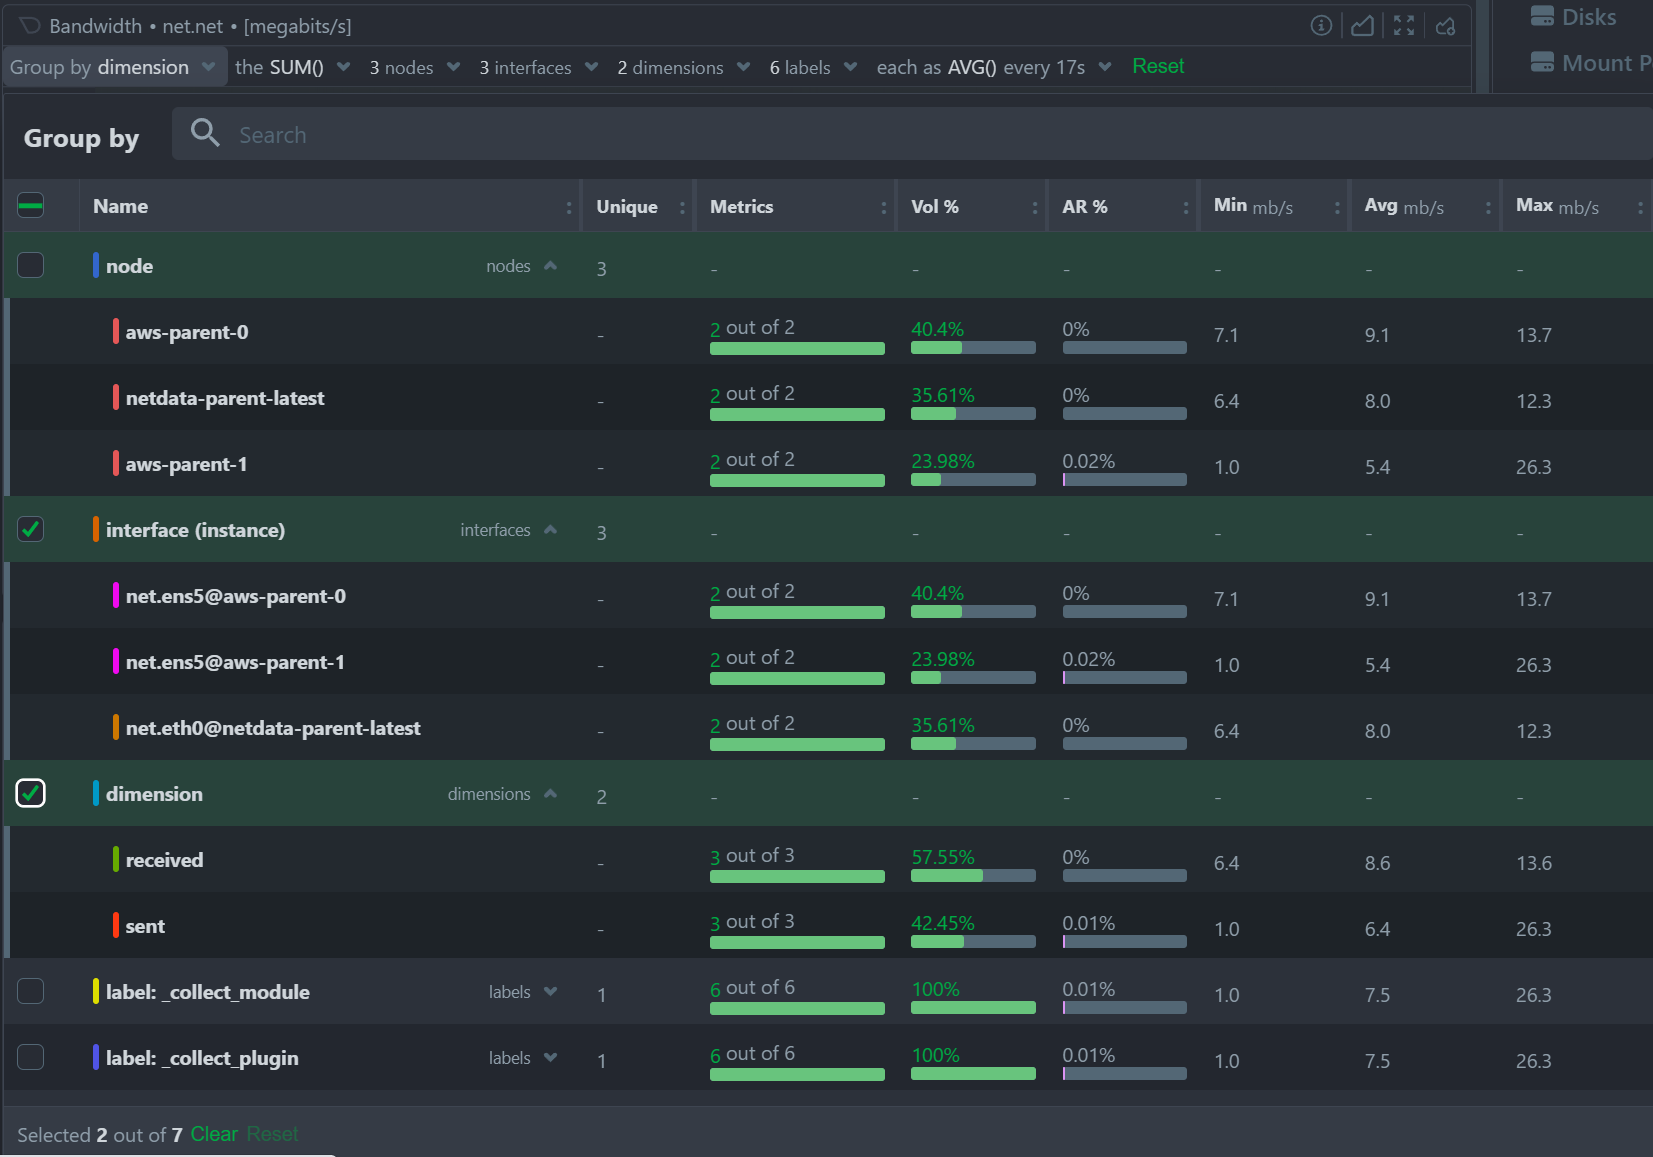
It supports:
- Group by Node, to summarize the data of each node, and provide one dimension on the chart for each of the nodes involved. Filtering nodes is supported at the same time, using the nodes dropdown menu.
- Group by Instance, to summarize the data of each instance and provide one dimension on the chart for each of the instances involved. Filtering instances is supported at the same time, using the instances dropdown menu.
- Group by Dimension, so that each metric in the visualization is the aggregation of a single dimension. This provides a per dimension view of the data from all the nodes in the War Room, taking into account filtering criteria if defined.
- Group by Label, to summarize the data for each label value. Multiple label keys can be selected at the same time.
Using this menu, you can slice and dice the data in any possible way, to quickly get different views of it, without the need to edit a query string and without any need to better understand the format of the underlying data.
Tip
A very pertinent example is composite charts over contexts related to cgroups (VMs and containers). You have the means to change the default group by or apply filtering to get a better view into what data your are trying to analyze. For example, if you change the group by to instance you get a view with the data of all the instances (cgroups) that contribute to that chart. Then you can use further filtering tools to focus the data that is important to you and even save the result to your own dashboards.
Tip
Group by instance, dimension to see the time series of every individual collected metric participating in the chart.
Aggregate functions over data sources dropdown
Each chart uses an opinionated-but-valuable default aggregate function over the data sources.
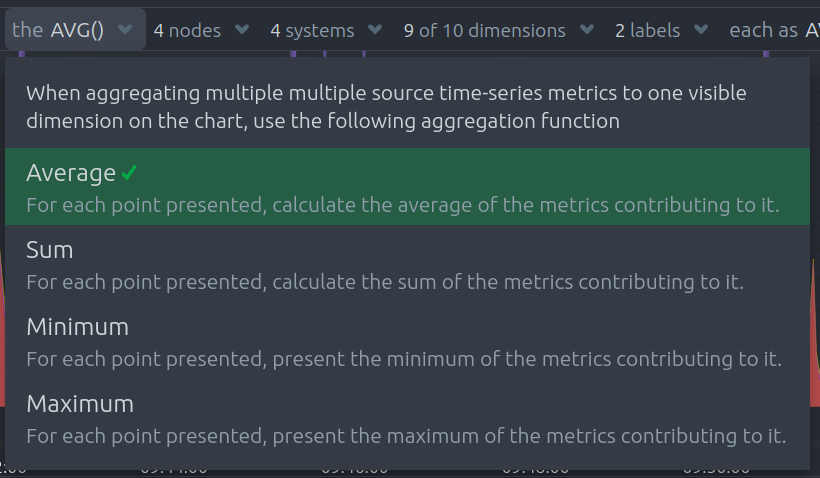
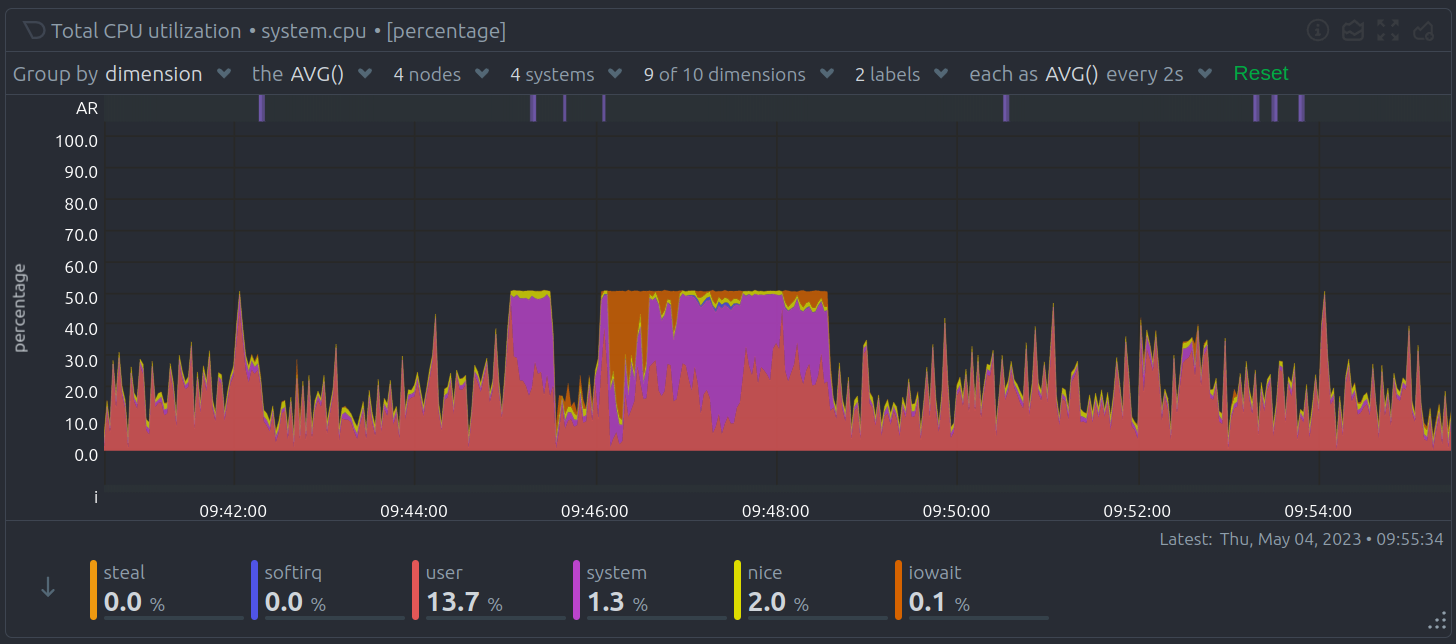
For example, the system.cpu chart shows the average for each dimension from every contributing chart, while the net.net chart shows the sum for each dimension from every contributing chart, which can also come from multiple networking interfaces.
The following aggregate functions are available for each selected dimension:
- Average: Displays the average value from contributing nodes. If a composite chart has 5 nodes with the following
values for the
outdimension—-2.1,-5.5,-10.2,-15,-0.1—the composite chart displays a value of−6.58. - Sum: Displays the sum of contributed values. Using the same nodes, dimension, and values as above, the composite
chart displays a metric value of
-32.9. - Min: Displays a minimum value. For dimensions with positive values, the min is the value closest to zero. For charts with negative values, the min is the value with the largest magnitude.
- Max: Displays a maximum value. For dimensions with positive values, the max is the value with the largest magnitude. For charts with negative values, the max is the value closet to zero.
Nodes dropdown
In this dropdown, you can view or filter the nodes contributing time-series metrics to the chart.
This menu also provides the contribution of each node to the volume of the chart, and a break down of the anomaly rate of the queried data per node.
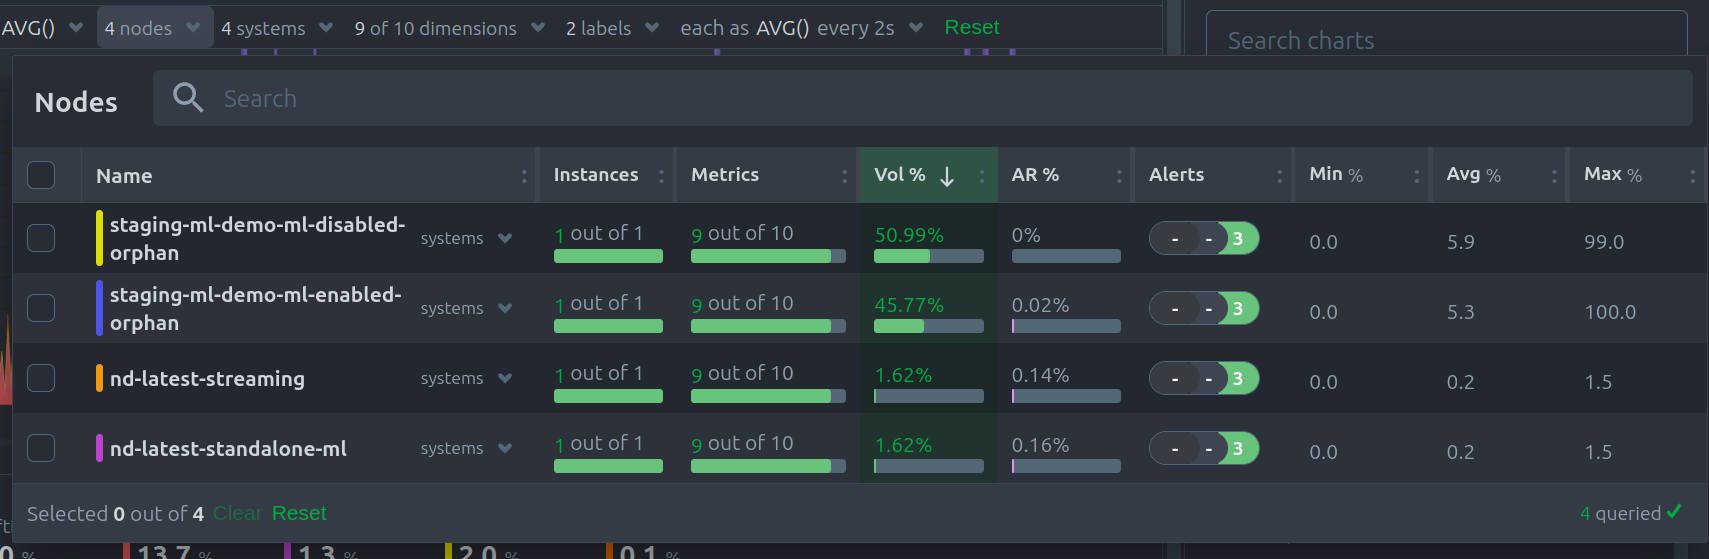
If one or more nodes can't contribute to a given chart, the definition bar shows a warning symbol plus the number of
affected nodes, then lists them in the dropdown along with the associated error. Nodes might return errors because of
networking issues, a stopped netdata service, or because that node does not have any metrics for that context.
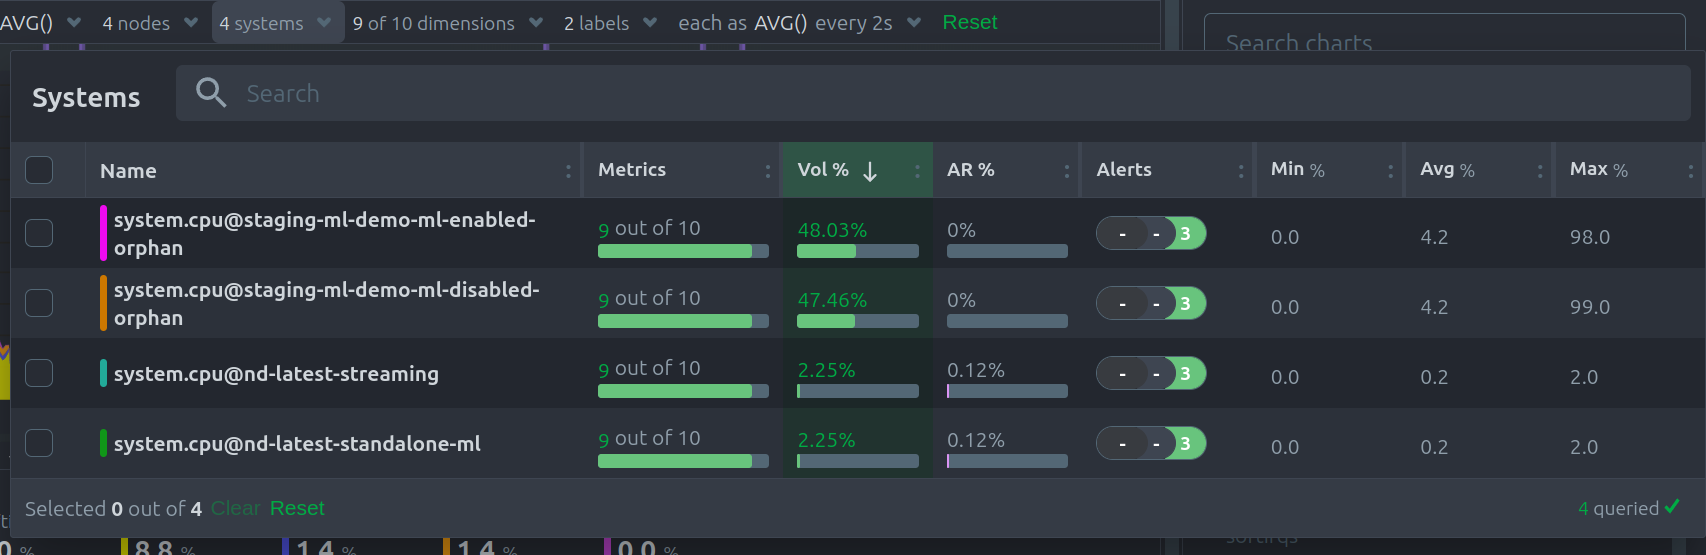
Instances dropdown
In this dropdown, you can view or filter the instances contributing time-series metrics to the chart.
This menu also provides the contribution of each instance to the volume of the chart, and a break down of the anomaly rate of the queried data per instance.
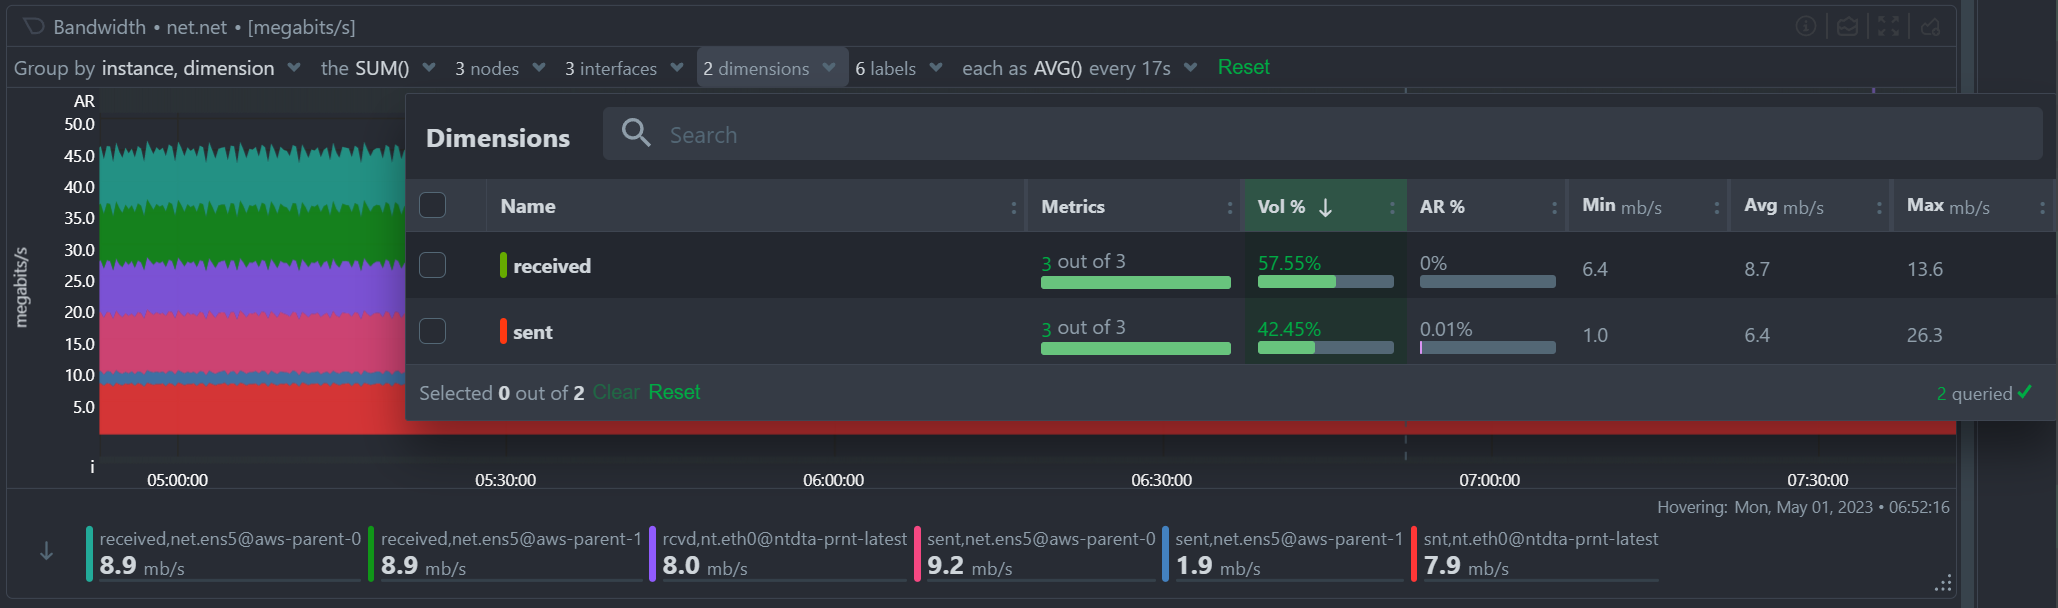
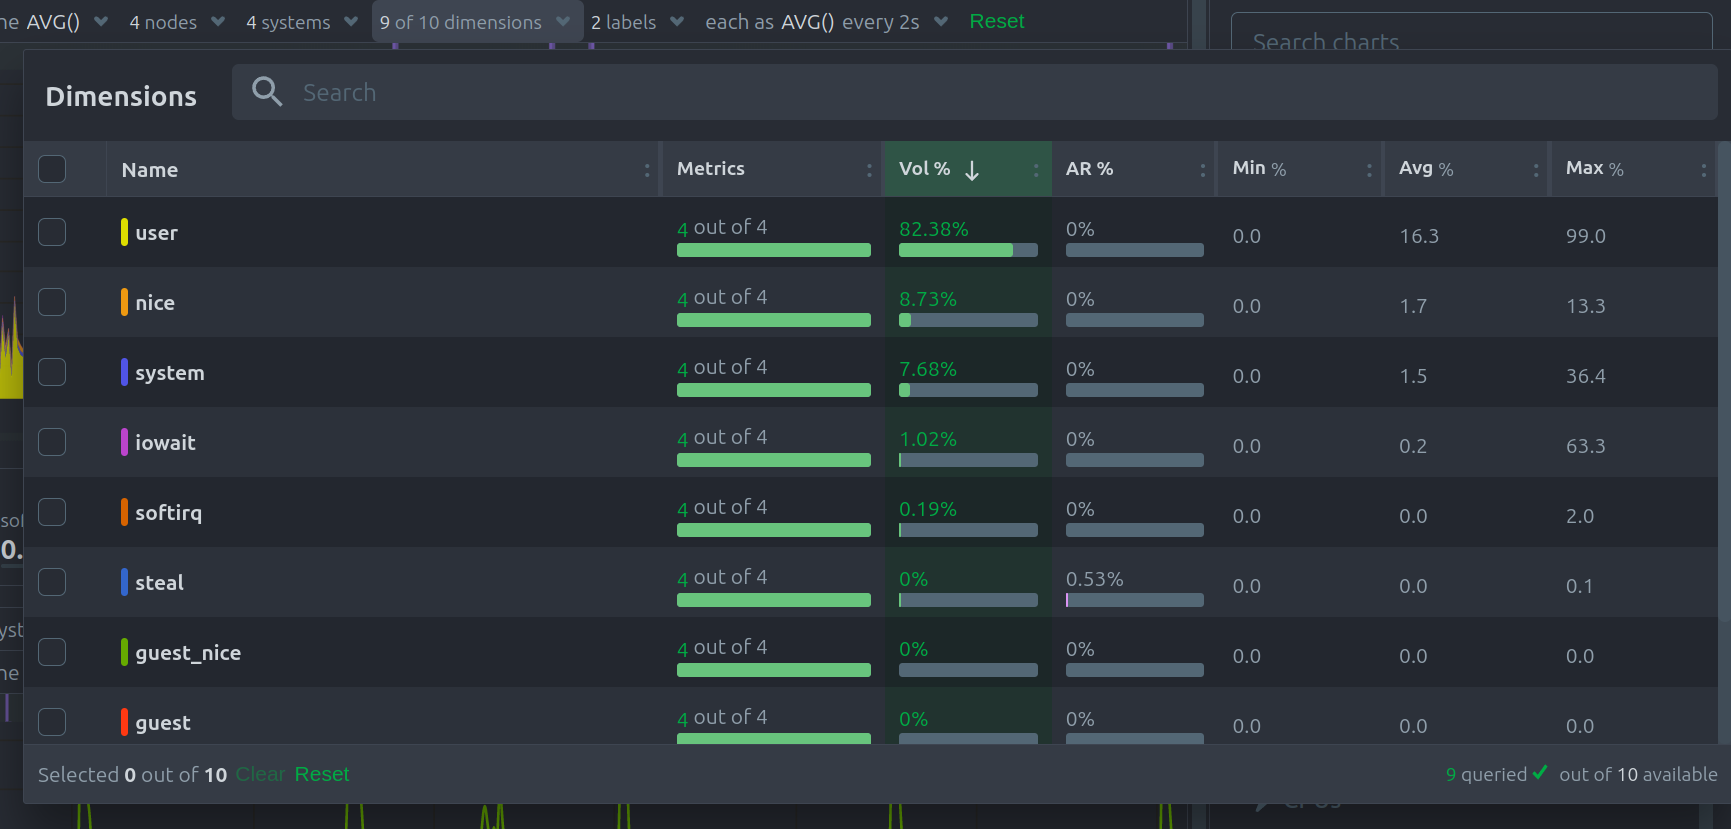
Dimensions dropdown
In this dropdown, you can view or filter the original dimensions contributing time-series metrics to the chart.
This menu also presents the contribution of each original dimensions on the chart, and a break down of the anomaly rate of the data per dimension.
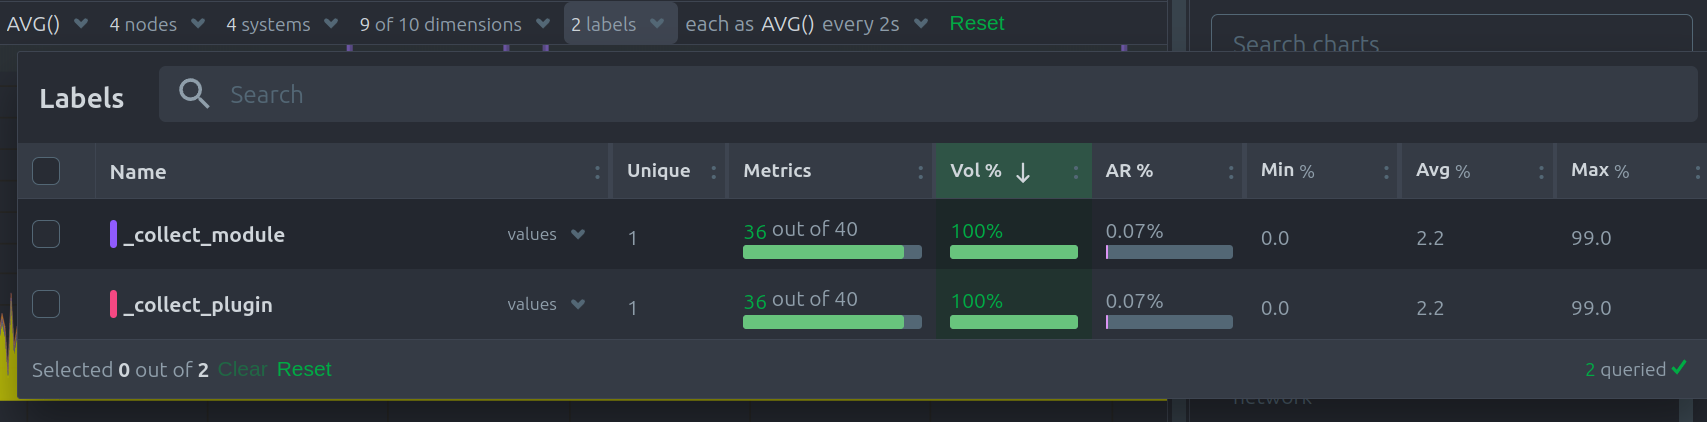
Labels dropdown
In this dropdown, you can view or filter the contributing time-series labels of the chart.
This menu also presents the contribution of each label on the chart,and a break down of the anomaly rate of the data per label.
Aggregate functions over time
When the granularity of the data collected is higher than the plotted points on the chart an aggregation function over time is applied.
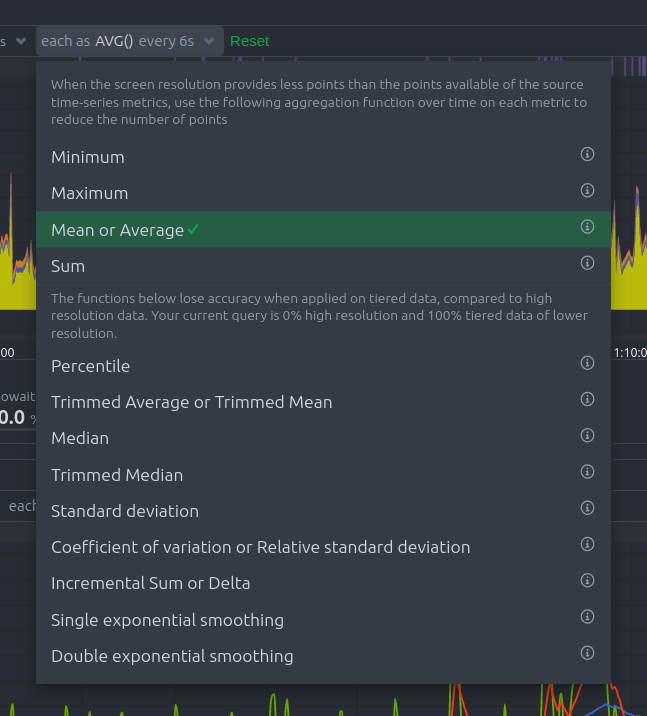
By default the aggregation applied is average but the user can choose different options from the following:
- Min, Max, Average or Sum
- Percentile
- you can specify the percentile you want to focus on: 25th, 50th, 75th, 80th, 90th, 95th, 97th, 98th and 99th.

- you can specify the percentile you want to focus on: 25th, 50th, 75th, 80th, 90th, 95th, 97th, 98th and 99th.
- Trimmed Mean or Trimmed Median
- you can choose the percentage of data tha you want to focus on: 1%, 2%, 3%, 5%, 10%, 15%, 20% and 25%.

- you can choose the percentage of data tha you want to focus on: 1%, 2%, 3%, 5%, 10%, 15%, 20% and 25%.
- Median
- Standard deviation
- Coefficient of variation
- Delta
- Single or Double exponential smoothing
For more details on each, you can refer to our Agent's HTTP API details on Data Queries - Data Grouping.
Reset to defaults
Finally, you can reset everything to its defaults by clicking the green "Reset" prompt at the end of the definition bar.
Anomaly Rate ribbon
Netdata's unsupervised machine learning algorithm creates a unique model for each metric collected by your agents, using exclusively the metric's past data. It then uses these unique models during data collection to predict the value that should be collected and check if the collected value is within the range of acceptable values based on past patterns and behavior.
If the value collected is an outlier, it is marked as anomalous.
This unmatched capability of real-time predictions as data is collected allows you to detect anomalies for potentially millions of metrics across your entire infrastructure within a second of occurrence.
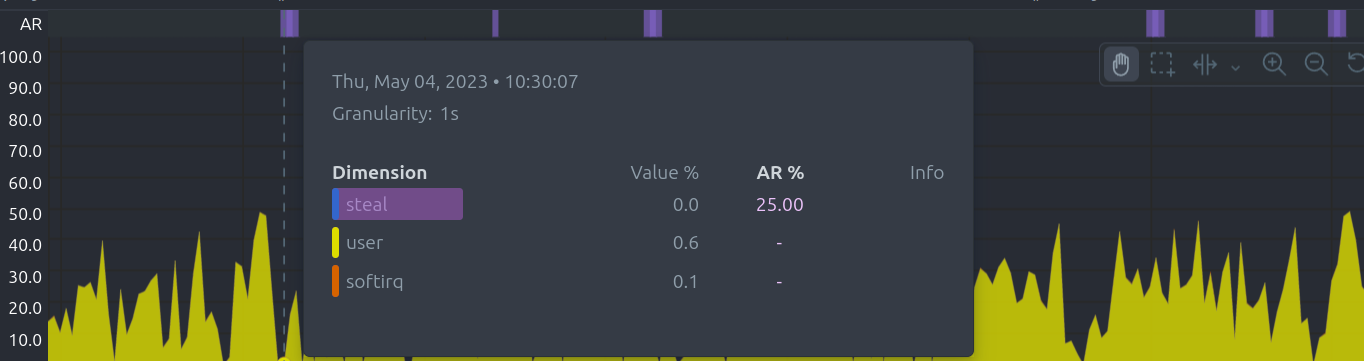
The Anomaly Rate ribbon on top of each chart visualizes the combined anomaly rate of all the underlying data, highlighting areas of interest that may not be easily visible to the naked eye.
Hovering over the Anomaly Rate ribbon provides a histogram of the anomaly rates per presented dimension, for the specific point in time.
Anomaly Rate visualization does not make Netdata slower. Anomaly rate is saved in the Netdata database, together with metric values, and due to the smart design of Netdata, it does not even incur a disk footprint penalty.
Hover over the chart
Hovering over any point in the chart will reveal a more informative overlay. It includes a bar indicating the volume percentage of each time series compared to the total, the anomaly rate, and a notification on if there are data collection issues.
This overlay sorts all dimensions by value, makes bold the closest dimension to the mouse and presents a histogram based on the values of the dimensions.
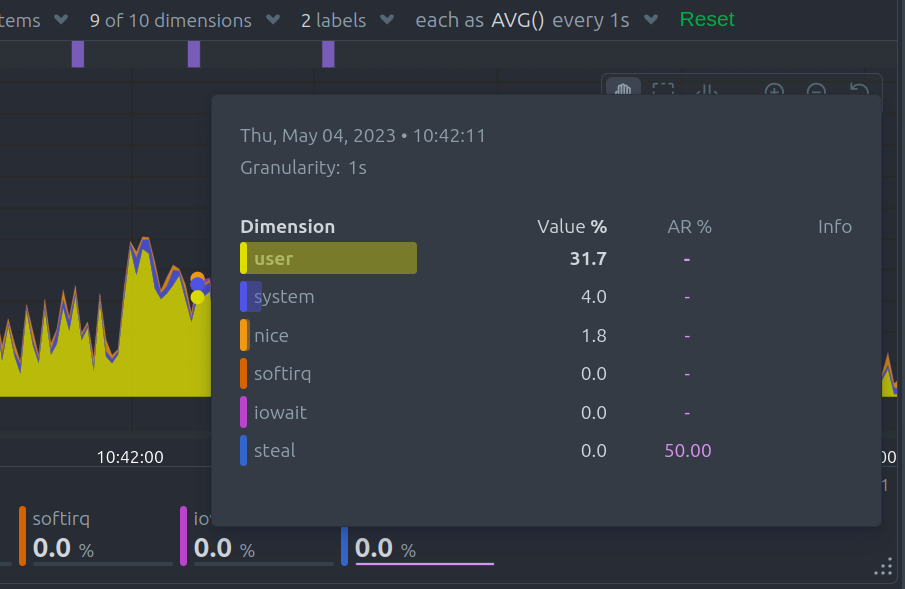
When hovering the anomaly ribbon, the overlay sorts all dimensions by anomaly rate, and presents a histogram of these anomaly rates.
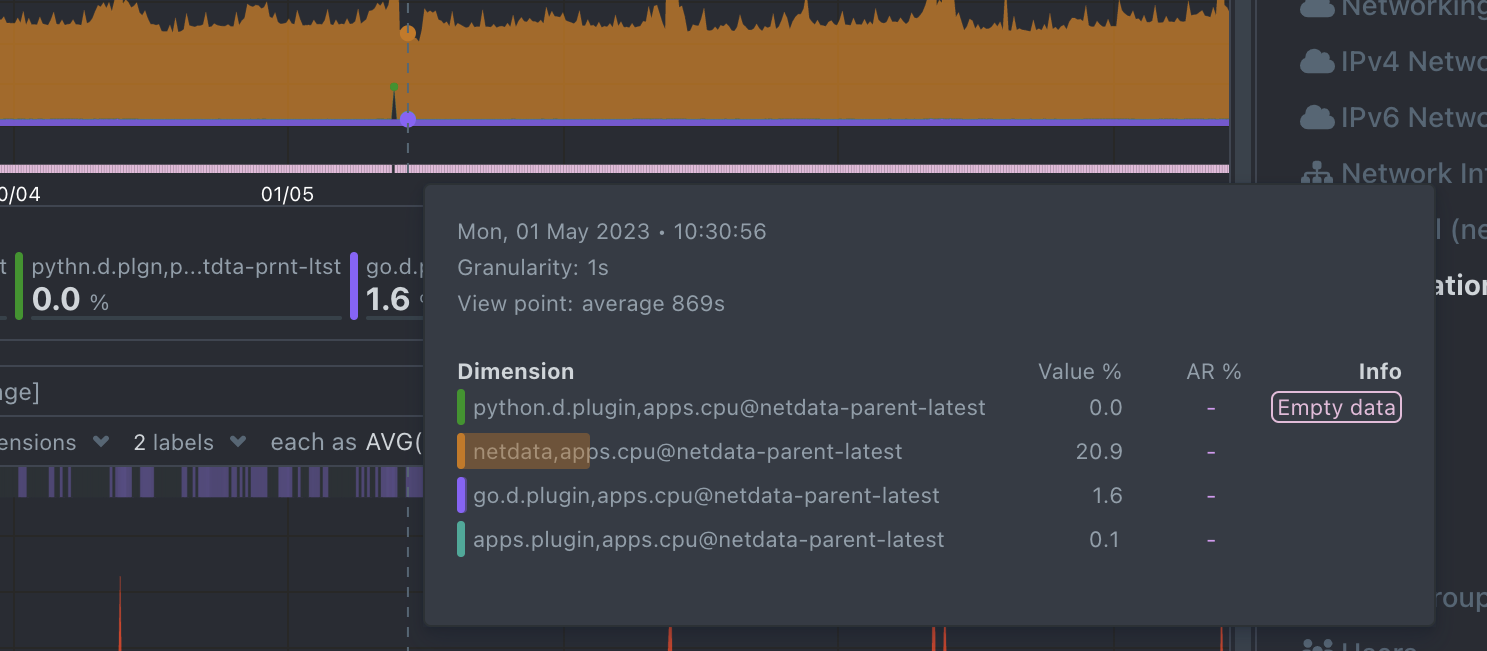
Info column
Additionally, when hovering over the chart, the overlay may display an indication in the "Info" column.
Currently, this column is used to inform users of any data collection issues that might affect the chart. Below each chart, there is an information ribbon. This ribbon currently shows 3 states related to the points presented in the chart:
[P]: Partial Data At least one of the dimensions in the chart has partial data, meaning that not all instances available contributed data to this point. This can happen when a container is stopped, or when a node is restarted. This indicator helps to gain confidence of the dataset, in situations when unusual spikes or dives appear due to infrastructure maintenance, or due to failures to part of the infrastructure.
[O]: Overflown At least one of the data sources included in the chart has a counter that has overflowed at this point.
[E]: Empty Data At least one of the dimensions included in the chart has no data at all for the given points.
All these indicators are also visualized per dimension, in the pop-over that appears when hovering the chart.
Play, Pause and Reset
Your charts are controlled using the available Time controls. Besides these, when interacting with the chart you can also activate these controls by:
- Hovering over any chart to temporarily pause it - this momentarily switches time control to Pause, so that you can hover over a specific timeframe. When moving out of the chart time control will go back to Play (if it was it's previous state)
- Clicking on the chart to lock it - this enables the Pause option on the time controls, to the current timeframe. This is if you want to jump to a different chart to look for possible correlations.
- Double clicking to release a previously locked chart - move the time control back to Play
| Interaction | Keyboard/mouse | Touchpad/touchscreen | Time control |
|---|---|---|---|
| Pause a chart | hover | n/a | Temporarily Pause |
| Stop a chart | click | tap | Pause |
| Reset a chart | double click | n/a | Play |
Note: These interactions are available when the default "Pan" action is used from the Tool Bar.
Tool bar
While exploring the chart, a tool bar will appear. This tool bar is there to support you on this task. The available manipulation tools you can select are:
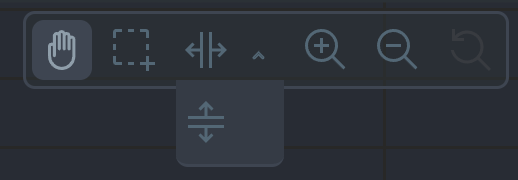
- Pan
- Highlight
- Select and zoom
- Chart zoom
- Reset zoom
Pan
Drag your mouse/finger to the right to pan backward through time, or drag to the left to pan forward in time. Think of it like pushing the current timeframe off the screen to see what came before or after.
| Interaction | Keyboard | Mouse | Touchpad/touchscreen |
|---|---|---|---|
| Pan | n/a | click + drag | touch drag |
Highlight
Selecting timeframes is useful when you see an interesting spike or change in a chart and want to investigate further by:
- Looking at the same period of time on other charts/sections
- Running metric correlations to filter metrics that also show something different in the selected period, vs the previous one
| Interaction | Keyboard/mouse | Touchpad/touchscreen |
|---|---|---|
| Highlight a specific timeframe | Alt + mouse selection or ⌘ + mouse selection (macOS) | n/a |
Select and zoom
You can zoom to a specific timeframe, either horizontally of vertically, by selecting a timeframe.
| Interaction | Keyboard/mouse | Touchpad/touchscreen |
|---|---|---|
| Zoom to a specific timeframe | Shift + mouse vertical selection | n/a |
| Horizontal Zoom a specific Y-axis area | Shift + mouse horizontal selection | n/a |
Chart zoom
Zooming in helps you see metrics with maximum granularity, which is useful when you're trying to diagnose the root cause of an anomaly or outage.
Zooming out lets you see metrics within the larger context, such as the last hour, day, or week, which is useful in understanding what "normal" looks like, or to identify long-term trends, like a slow creep in memory usage.
| Interaction | Keyboard/mouse | Touchpad/touchscreen |
|---|---|---|
| Zoom in or out | Shift + mouse scrollwheel | two-finger pinch Shift + two-finger scroll |
Dimensions bar
Order dimensions legend
The bottom legend where you can see the dimensions of the chart can be ordered by:
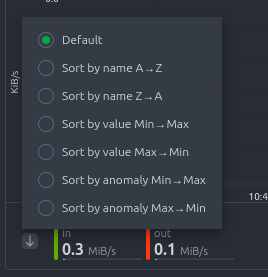
- Dimension name (Ascending or Descending)
- Dimension value (Ascending or Descending)
- Dimension Anomaly Rate (Ascending or Descending)
Show and hide dimensions
Hiding dimensions simplifies the chart and can help you better discover exactly which aspect of your system might be behaving strangely.
| Interaction | Keyboard/mouse | Touchpad/touchscreen |
|---|---|---|
| Show one dimension and hide others | click | tap |
| Toggle (show/hide) one dimension | Shift + click | n/a |
Resize a chart
To resize the chart, click-and-drag the icon on the bottom-right corner of any chart. To restore the chart to its original height, double-click the same icon.
Do you have any feedback for this page? If so, you can open a new issue on our netdata/learn repository.