Anomaly Analysis
Get a forensics‑grade explanation of unusual behavior. The Anomaly Analysis report correlates ML‑detected anomalies across nodes and metrics, reconstructs the timeline, and proposes likely root causes with supporting evidence.
When to use it
- Post‑incident analysis and RCA preparation
- Investigating “what changed here?” on a chart or service
- Validating whether anomalies were symptoms or causes
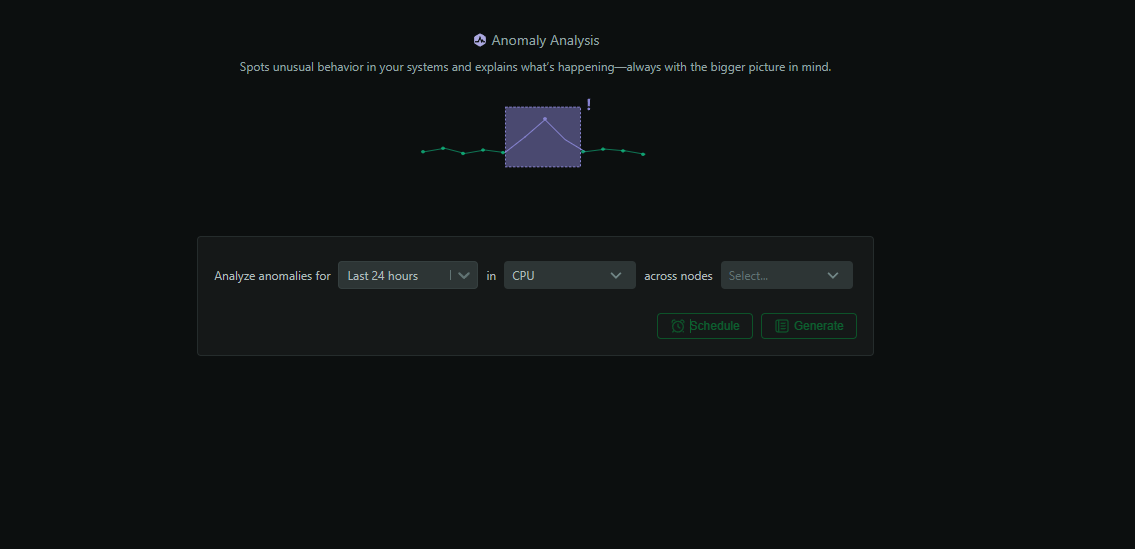
How to generate
- In Netdata Cloud, open
Insights - Select
Anomaly Analysis - Choose the time window around the event of interest
- Scope to affected services/nodes if known
- Click
Generate
What’s analyzed
- Agent‑side ML anomaly scores (every metric, every second)
- Temporal propagation of anomalies across metrics/services
- Correlations with alerts, deployments, and configuration changes
- Cross‑node relationships and influence chains
What you get
- Narrative of how the incident unfolded
- Ranked list of likely root causes vs. downstream effects
- Key correlated signals and “why this matters” notes
- Recommendations to prevent recurrence
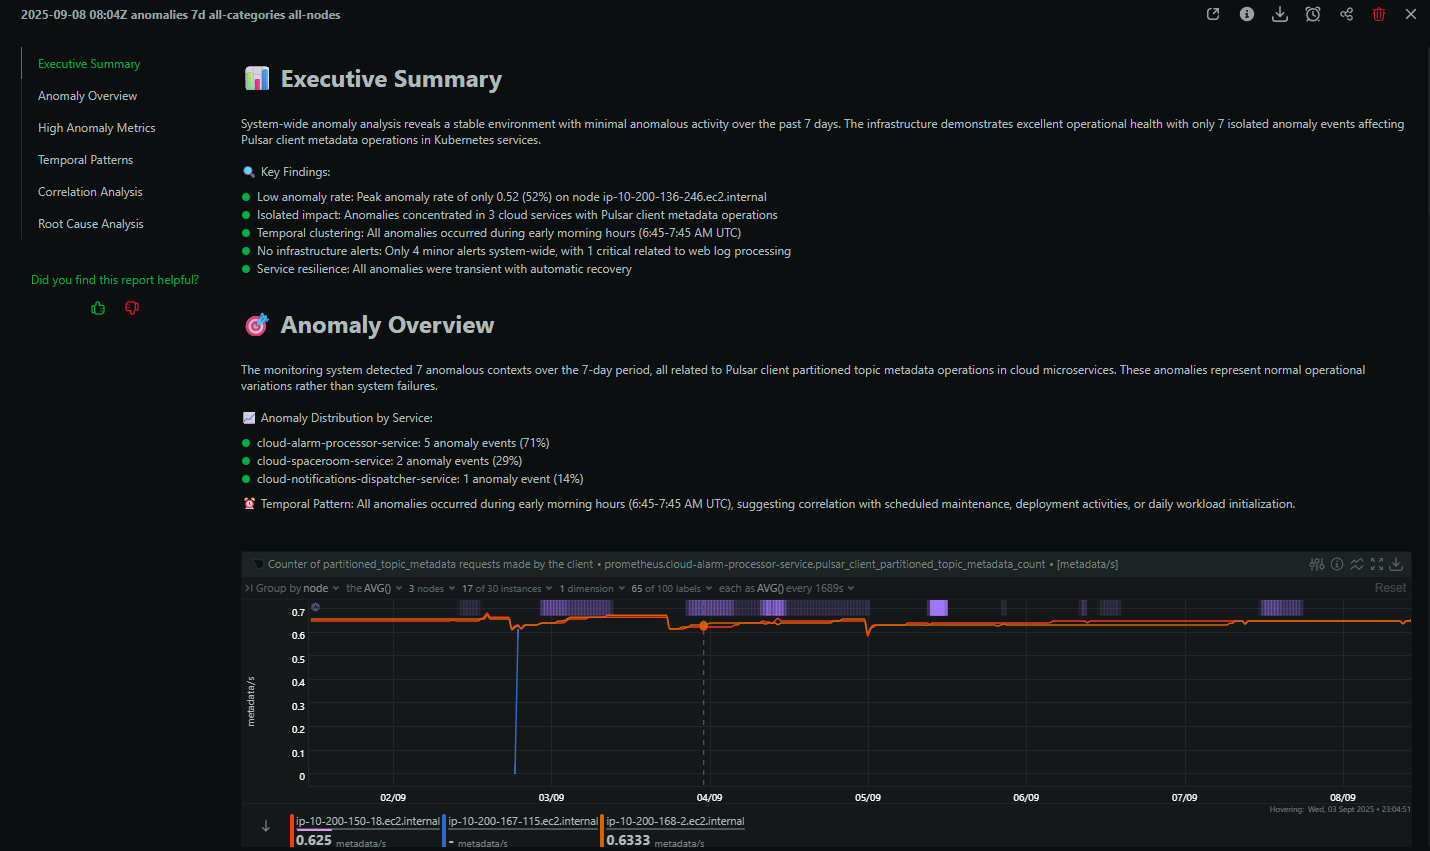
Example: “What changed here?”
Point the report at a suspicious time window and let it reconstruct the change: which metrics shifted first, where anomalies clustered, and which changes correlate strongly with the observed behavior.
Related tools
- Use the
Anomaly Advisortab for interactive exploration - Combine with
Metric Correlationsto focus the search space
Availability and usage
- Available on Business and Free Trial plans
- Each report consumes 1 AI credit (10 free per month on eligible plans)
Do you have any feedback for this page? If so, you can open a new issue on our netdata/learn repository.