Performance Optimization
Find bottlenecks before users notice. The Performance Optimization report analyzes contention patterns, throttling risks, and systemic inefficiencies, then produces prioritized, concrete remediation steps tied to your observed workload.
When to use it
- Ongoing SRE/ops optimization workstreams
- After key deploys, major configuration changes, or scaling events
- To prepare proposals for performance investments or capacity changes
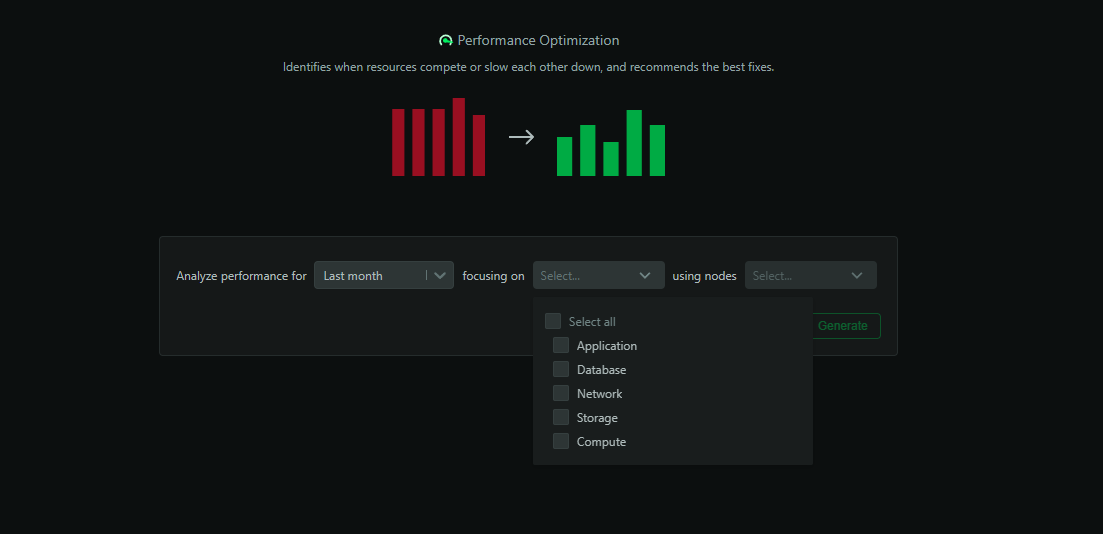
How to generate
- Open the
Insightstab in Netdata Cloud - Select
Performance Optimization - Choose a window (e.g., last 24h, 7d, 30d, or custom)
- Scope to infrastructure segments (rooms/spaces) or services of interest
- Click
Generate
What’s analyzed
- CPU and memory saturation, noisy neighbors, and throttling signals
- Disk IO, queue depths, saturation ratios, filesystem pressure
- Network throughput, packet loss, retransmits, egress hot spots
- Container and pod throttling, OOM risks, scheduling pressure
- Database/service bottlenecks and backpressure evidence
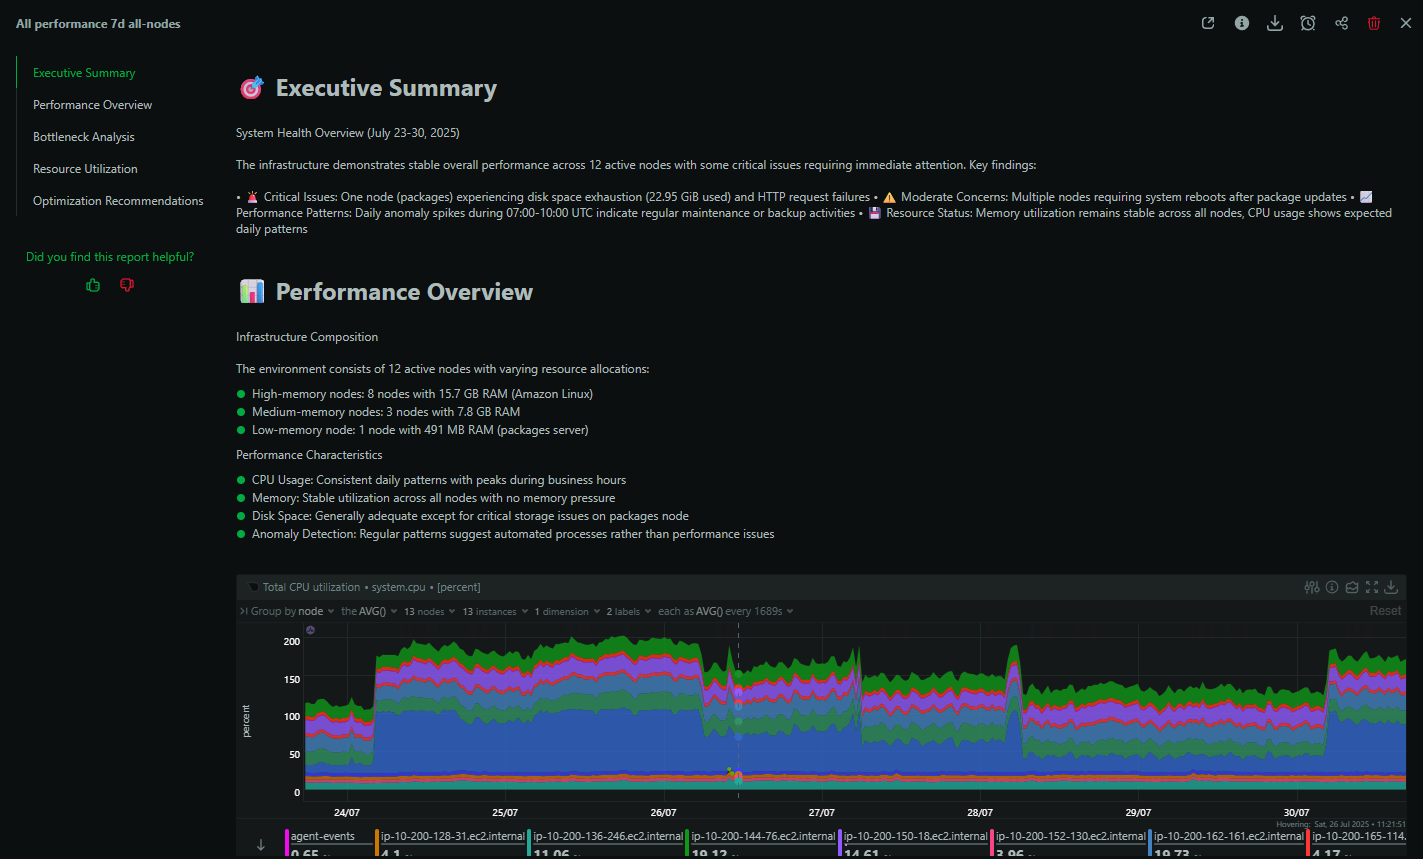
What you get
- Ranked list of bottlenecks with severity and confidence
- Correlated signals to distinguish cause vs. symptom
- Specific tuning and right‑sizing recommendations
- Expected impact estimates where feasible (latency/throughput)
- Before/after projections for planned changes (when applicable)
Example: Debugging Kubernetes performance
An SRE investigating cluster slowness sees synthesized findings about container throttling, resource contention on specific nodes, and recommended limit/request adjustments—with nodes and workloads called out explicitly.
Best practices
- Run monthly for baselining; run ad‑hoc after notable changes
- Use findings to drive tickets with clear owners and measurable goals
- Combine with
Capacity Planningfor a balanced performance/cost view
Availability and usage
- Available on Business and Free Trial plans
- Each report consumes 1 AI credit (10 free per month on eligible plans)
- Results are saved in Insights and downloadable as PDFs
Do you have any feedback for this page? If so, you can open a new issue on our netdata/learn repository.