Monitor any process in real-time with Netdata
Netdata is more than a multitude of generic system-level metrics and visualizations. Instead of providing only a bird's eye view of your system, leaving you to wonder exactly what is taking up 99% CPU, Netdata also gives you visibility into every layer of your node. These additional layers give you context, and meaningful insights, into the true health and performance of your infrastructure.
One of these layers is the process. Every time a Linux system runs a program, it creates an independent process that
executes the program's instructions in parallel with anything else happening on the system. Linux systems track the
state and resource utilization of processes using the /proc filesystem, and
Netdata is designed to hook into those metrics to create meaningful visualizations out of the box.
While there are a lot of existing command-line tools for tracking processes on Linux systems, such as ps or top,
only Netdata provides dozens of real-time charts, at both per-second and event frequency, without you having to write
SQL queries or know a bunch of arbitrary command-line flags.
With Netdata's process monitoring, you can:
- Benchmark/optimize performance of standard applications, like web servers or databases
- Benchmark/optimize performance of custom applications
- Troubleshoot CPU/memory/disk utilization issues (why is my system's CPU spiking right now?)
- Perform granular capacity planning based on the specific needs of your infrastructure
- Search for leaking file descriptors
- Investigate zombie processes
... and much more. Let's get started.
Prerequisites
- One or more Linux nodes running Netdata
- A general understanding of how
to configure the Netdata Agent
using
edit-config. - A Netdata Cloud account. Sign up if you don't have one already.
How does Netdata do process monitoring?
The Netdata Agent already knows to look for hundreds
of standard applications that we support via collectors,
and groups them based on their
purpose. Let's say you want to monitor a MySQL
database using its process. The Netdata Agent already knows to look for processes with the string mysqld in their
name, along with a few others, and puts them into the sql group. This sql group then becomes a dimension in all
process-specific charts.
The process and groups settings are used by two unique and powerful collectors.
apps.plugin looks at the Linux
process tree every second, much like top or
ps fax, and collects resource utilization information on every running process. It then automatically adds a layer of
meaningful visualization on top of these metrics, and creates per-process/application charts.
ebpf.plugin: Netdata's extended
Berkeley Packet Filter (eBPF) collector
monitors Linux kernel-level metrics for file descriptors, virtual filesystem IO, and process management, and then hands
process-specific metrics over to apps.plugin for visualization. The eBPF collector also collects and visualizes
metrics on an event frequency, which means it captures every kernel interaction, and not just the volume of
interaction at every second in time. That's even more precise than Netdata's standard per-second granularity.
Per-process metrics and charts in Netdata
With these collectors working in parallel, Netdata visualizes the following per-second metrics for any process on your Linux systems:
- CPU utilization (
apps.cpu)- Total CPU usage
- User/system CPU usage (
apps.cpu_user/apps.cpu_system)
- Disk I/O
- Physical reads/writes (
apps.preads/apps.pwrites) - Logical reads/writes (
apps.lreads/apps.lwrites) - Open unique files (if a file is found open multiple times, it is counted just once,
apps.files)
- Physical reads/writes (
- Memory
- Real Memory Used (non-shared,
apps.mem) - Virtual Memory Allocated (
apps.vmem) - Minor page faults (i.e. memory activity,
apps.minor_faults)
- Real Memory Used (non-shared,
- Processes
- Threads running (
apps.threads) - Processes running (
apps.processes) - Carried over uptime (since the last Netdata Agent restart,
apps.uptime) - Minimum uptime (
apps.uptime_min) - Average uptime (
apps.uptime_average) - Maximum uptime (
apps.uptime_max) - Pipes open (
apps.pipes)
- Threads running (
- Swap memory
- Swap memory used (
apps.swap) - Major page faults (i.e. swap activity,
apps.major_faults)
- Swap memory used (
- Network
- Sockets open (
apps.sockets)
- Sockets open (
- eBPF file
- Number of calls to open files. (
apps.file_open) - Number of files closed. (
apps.file_closed) - Number of calls to open files that returned errors.
- Number of calls to close files that returned errors.
- Number of calls to open files. (
- eBPF syscall
- Number of calls to delete files. (
apps.file_deleted) - Number of calls to
vfs_write. (apps.vfs_write_call) - Number of calls to
vfs_read. (apps.vfs_read_call) - Number of bytes written with
vfs_write. (apps.vfs_write_bytes) - Number of bytes read with
vfs_read. (apps.vfs_read_bytes) - Number of calls to write a file that returned errors.
- Number of calls to read a file that returned errors.
- Number of calls to delete files. (
- eBPF process
- Number of process created with
do_fork. (apps.process_create) - Number of threads created with
do_forkor__x86_64_sys_clone, depending on your system's kernel version. (apps.thread_create) - Number of times that a process called
do_exit. (apps.task_close)
- Number of process created with
- eBPF net
- Number of bytes sent. (
apps.bandwidth_sent) - Number of bytes received. (
apps.bandwidth_recv)
- Number of bytes sent. (
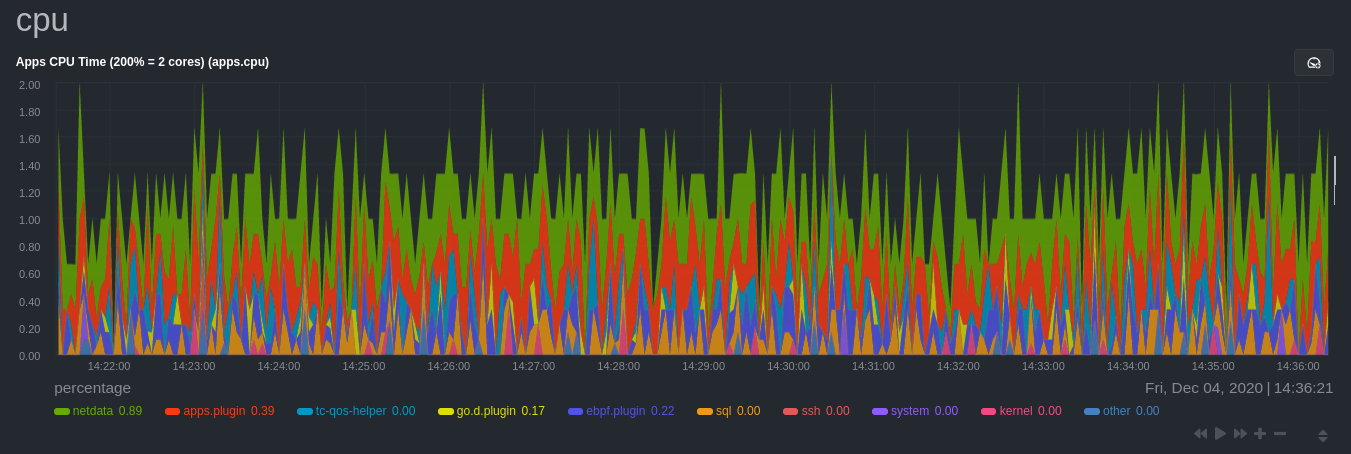
As an example, here's the per-process CPU utilization chart, including a sql group/dimension.
Configure the Netdata Agent to recognize a specific process
To monitor any process, you need to make sure the Netdata Agent is aware of it. As mentioned above, the Agent is already aware of hundreds of processes, and collects metrics from them automatically.
But, if you want to change the grouping behavior, add an application that isn't yet supported in the Netdata Agent, or
monitor a custom application, you need to edit the apps_groups.conf configuration file.
Navigate to your Netdata config directory and
use edit-config to edit the file.
cd /etc/netdata   # Replace this with your Netdata config directory if not at /etc/netdata.
sudo ./edit-config apps_groups.conf
Inside the file are lists of process names, oftentimes using wildcards (*), that the Netdata Agent looks for and
groups together. For example, the Netdata Agent looks for processes starting with mysqld, mariad, postgres, and
others, and groups them into sql. That makes sense, since all these processes are for SQL databases.
sql: mysqld* mariad* postgres* postmaster* oracle_* ora_* sqlservr
These groups are then reflected as dimensions within Netdata's charts.

See the following two sections for details based on your needs. If you don't need to configure apps_groups.conf, jump
down to visualizing process metrics.
Standard applications (web servers, databases, containers, and more)
As explained above, the Netdata Agent is already aware of most standard applications you run on Linux nodes, and you shouldn't need to configure it to discover them.
However, if you're using multiple applications that the Netdata Agent groups together you may want to separate them for
more precise monitoring. If you're not running any other types of SQL databases on that node, you don't need to change
the grouping, since you know that any MySQL is the only process contributing to the sql group.
Let's say you're using both MySQL and PostgreSQL databases on a single node, and want to monitor their processes
independently. Open the apps_groups.conf file as explained in
the section above and scroll down until you find
the database servers section. Create new groups for MySQL and PostgreSQL, and move their process queries into the
unique groups.
# -----------------------------------------------------------------------------
# database servers

mysql: mysqld*
postgres: postgres*
sql: mariad* postmaster* oracle_* ora_* sqlservr
Restart Netdata with sudo systemctl restart netdata, or
the appropriate method for your system, to start collecting utilization metrics
from your application. Time to visualize your process metrics.
Custom applications
Let's assume you have an application that runs on the process custom-app. To monitor eBPF metrics for that application
separate from any others, you need to create a new group in apps_groups.conf and associate that process name with it.
Open the apps_groups.conf file as explained in
the section above. Scroll down
to # NETDATA processes accounting.
Above that, paste in the following text, which creates a new custom-app group with the custom-app process. Replace
custom-app with the name of your application's Linux process. apps_groups.conf should now look like this:
...
# -----------------------------------------------------------------------------
# Custom applications to monitor with apps.plugin and ebpf.plugin

custom-app: custom-app

# -----------------------------------------------------------------------------
# NETDATA processes accounting
...
Restart Netdata with sudo systemctl restart netdata, or
the appropriate method for your system, to start collecting utilization metrics
from your application.
Visualize process metrics
Now that you're collecting metrics for your process, you'll want to visualize them using Netdata's real-time,
interactive charts. Find these visualizations in the same section regardless of whether you
use Netdata Cloud for infrastructure monitoring, or single-node monitoring with the local
Agent's dashboard at http://localhost:19999.
If you need a refresher on all the available per-process charts, see the above list.
Using Netdata's application collector (apps.plugin)
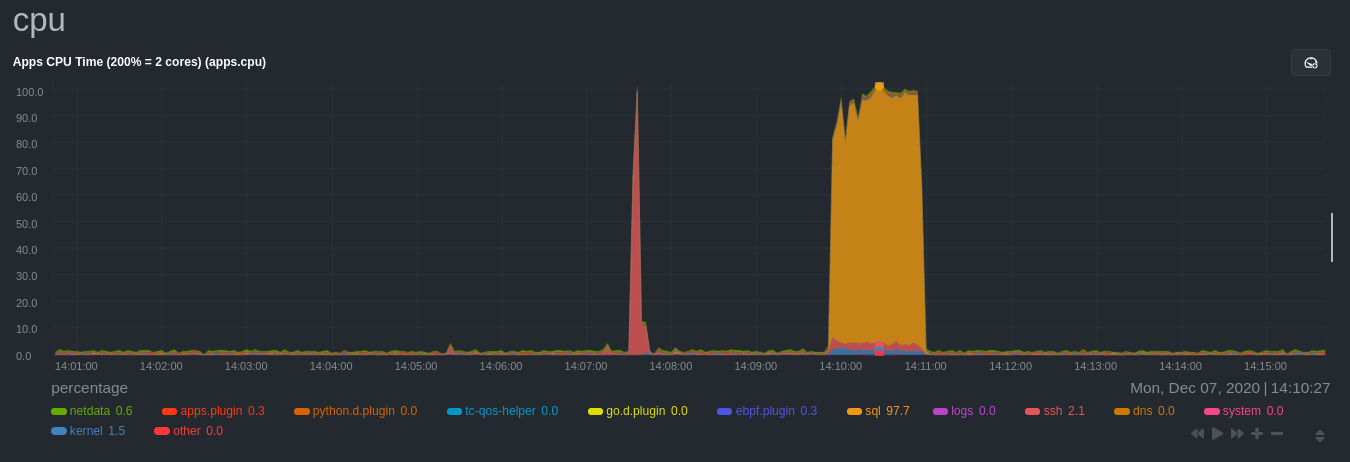
apps.plugin puts all of its charts under the Applications section of any Netdata dashboard.
Let's continue with the MySQL example. We can create a test
database in
MySQL to generate load on the mysql process.
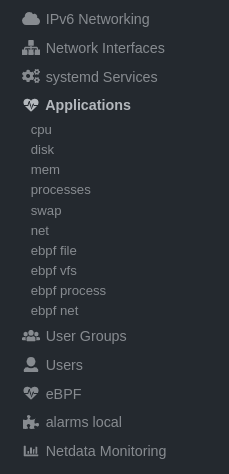
apps.plugin immediately collects and visualizes this activity apps.cpu chart, which shows an increase in CPU
utilization from the sql group. There is a parallel increase in apps.pwrites, which visualizes writes to disk.
Next, the mysqlslap utility queries the database to provide some benchmarking load on the MySQL database. It won't
look exactly like a production database executing lots of user queries, but it gives you an idea into the possibility of
these visualizations.
sudo mysqlslap --user=sysadmin --password --host=localhost --concurrency=50 --iterations=10 --create-schema=employees --query="SELECT * FROM dept_emp;" --verbose
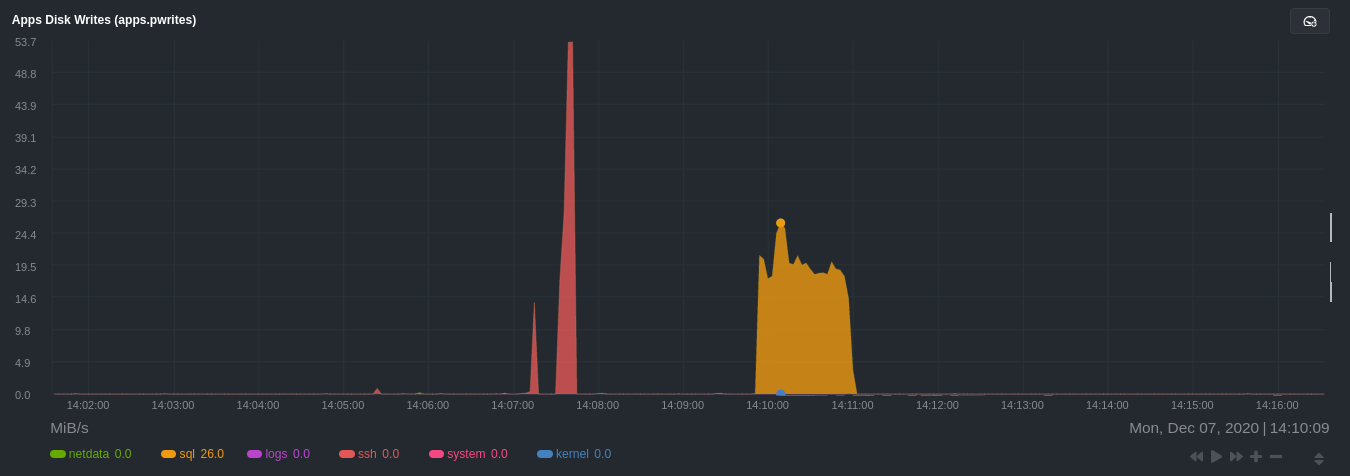
The following per-process disk utilization charts show spikes under the sql group at the same time mysqlslap was run
numerous times, with slightly different concurrency and query options.
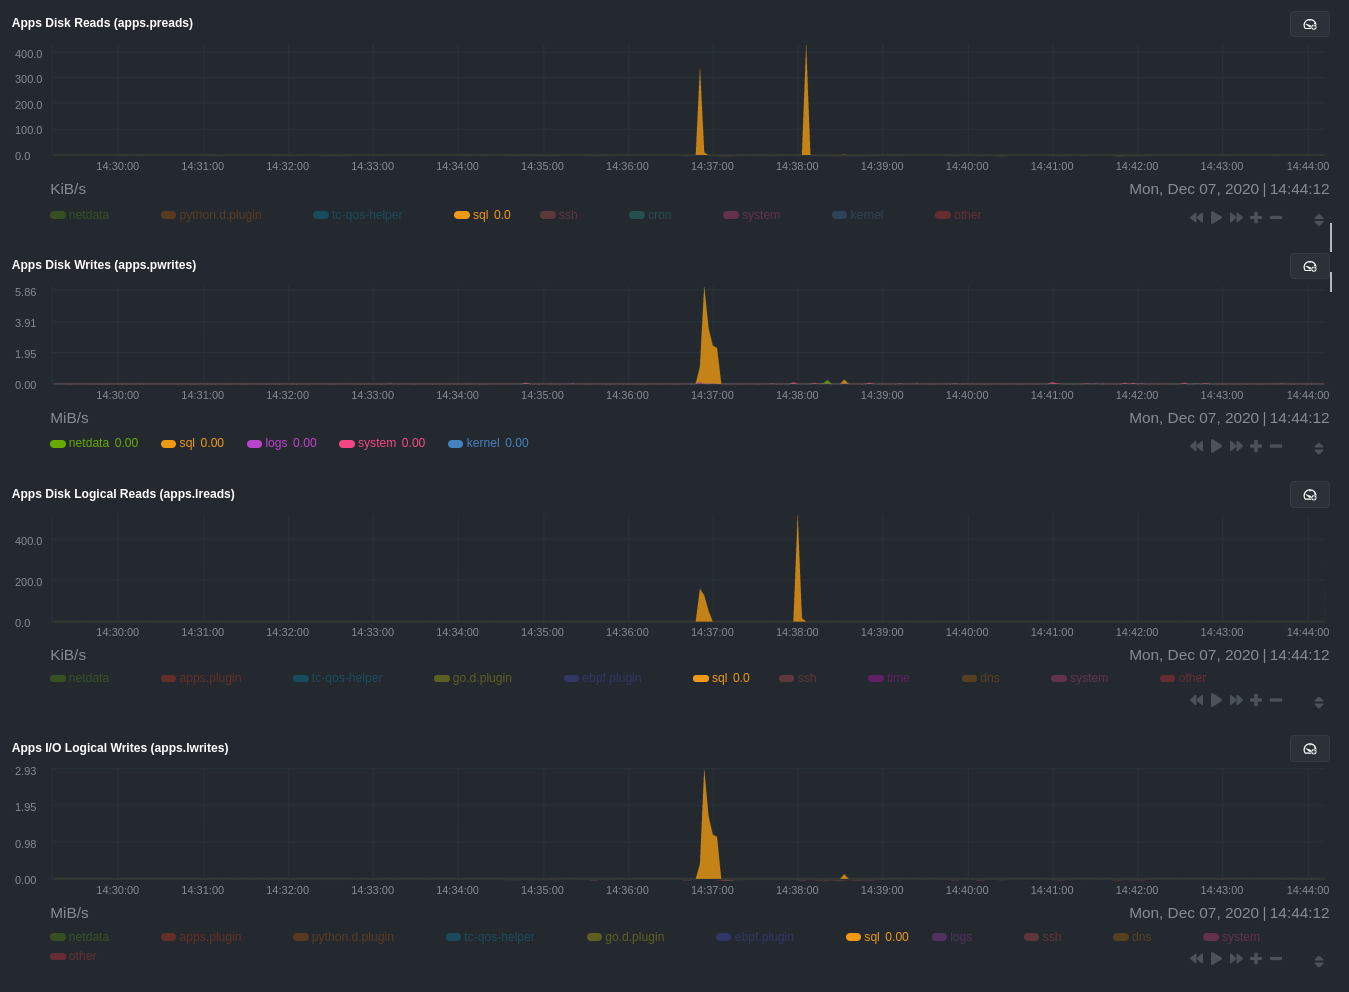
💡 Click on any dimension below a chart in Netdata Cloud (or to the right of a chart on a local Agent dashboard), to visualize only that dimension. This can be particularly useful in process monitoring to separate one process' utilization from the rest of the system.
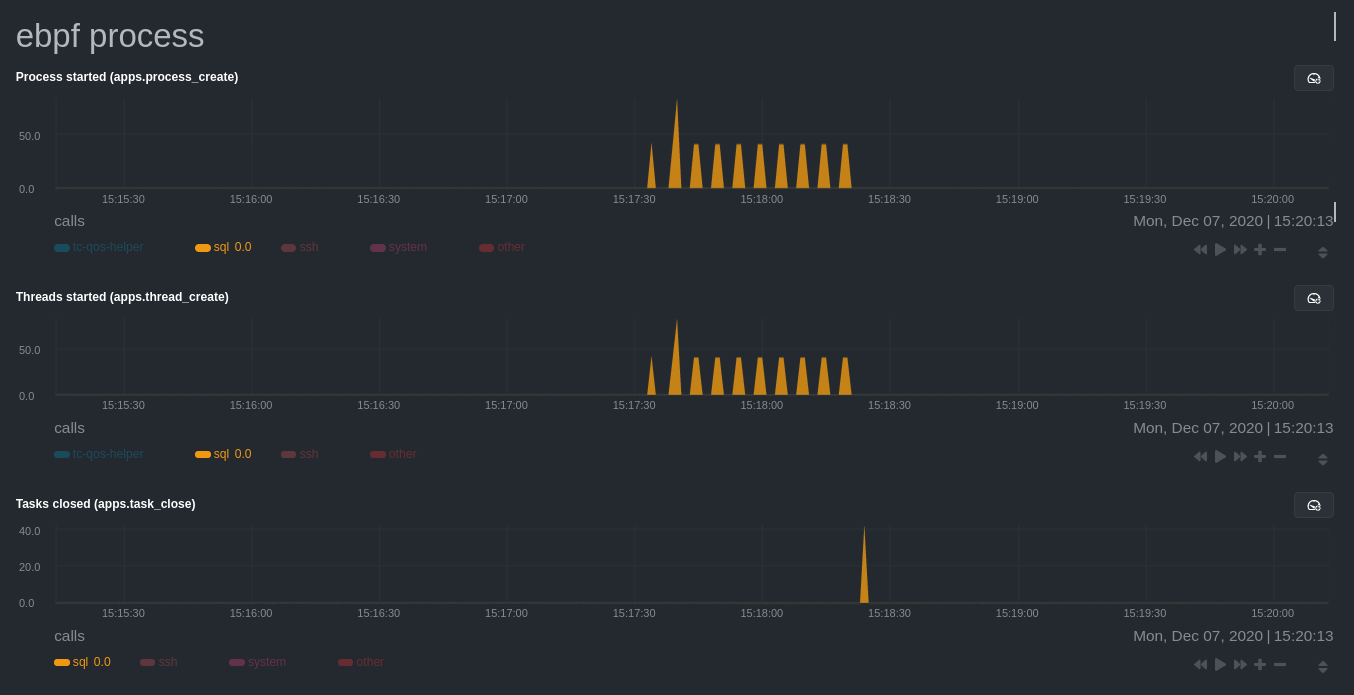
Using Netdata's eBPF collector (ebpf.plugin)
Netdata's eBPF collector puts its charts in two places. Of most importance to process monitoring are the ebpf file, ebpf syscall, ebpf process, and ebpf net sub-sections under Applications, shown in the above screenshot.
For example, running the above workload shows the entire "story" how MySQL interacts with the Linux kernel to open processes/threads to handle a large number of SQL queries, then subsequently close the tasks as each query returns the relevant data.
ebpf.plugin visualizes additional eBPF metrics, which are system-wide and not per-process, under the eBPF section.
Do you have any feedback for this page? If so, you can open a new issue on our netdata/learn repository.